Gold Price Today: Market Meltdown or Healthy Correction? 2026 Vision
The gold market is currently witnessing one of its most volatile periods in modern history. After a relentless rally that saw the yellow metal shatter records in January 2026, the start of February has brought a "metals meltdown" that has sent shock-waves through global exchanges.
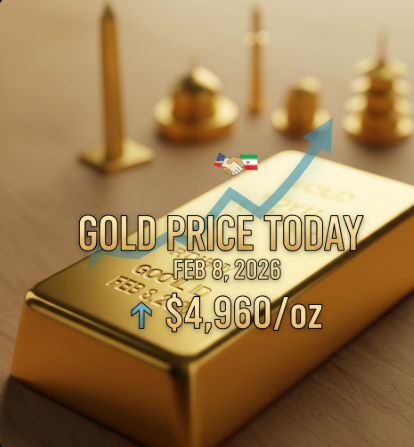
If you are tracking gold prices today, February 2, 2026, here is the essential breakdown of the market vision, the drivers behind the crash, and the long-term forecast.
Following a historic plunge on Friday, gold has extended its decline today. After peaking near an astronomical $5,600 per ounce last week, prices have retreated sharply.
Spot Gold: Trading near $4,650 – $4,750 per ounce (down approx. 2-4% today after an 11% drop on Friday).
Intraday Low: Gold tested the $4,400 level earlier today before finding some technical support.
Domestic Impact (Vietnam/India): SJC gold bars fell to approximately 167–172 million VND, while Indian 24K gold rates dipped toward ₹1,50,000 per 10 grams.
Market Note: Despite the recent "crash," gold remains up over 65% year-on-year, reminding investors that the long-term trend has been overwhelmingly bullish.
Why is Gold Falling Today?
The sudden reversal in gold’s "parabolic" rally is being driven by a perfect storm of macroeconomic and political shifts:
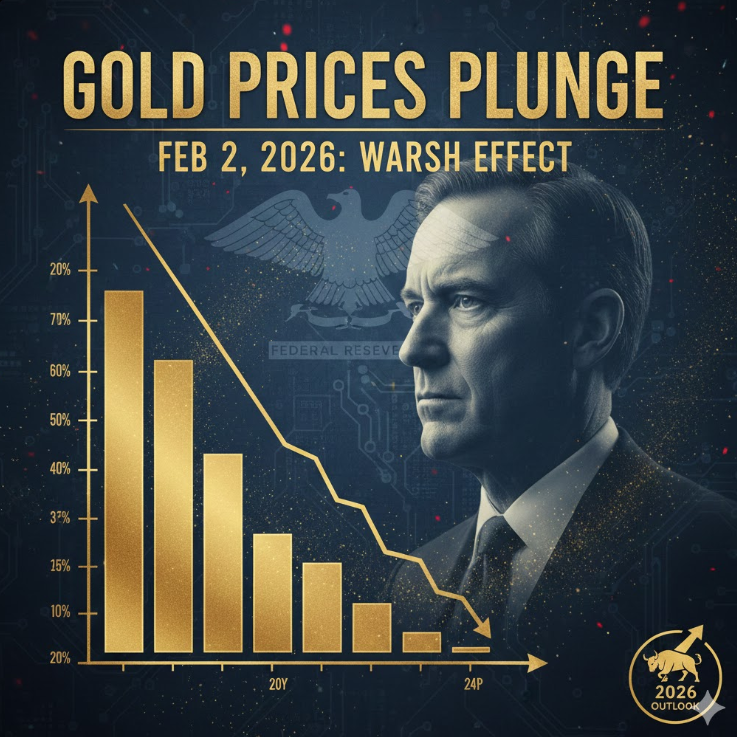
The "Warsh Effect": President Trump’s nomination of Kevin Warsh to lead the Federal Reserve has been the primary catalyst. Warsh is viewed as a "hawkish" pick, leading markets to price in a stronger US Dollar and a more disciplined approach to interest rates.
The Great Liquidation: Friday’s sell-off triggered a $15 trillion cascade in precious metals. High margin requirements and forced liquidations on leveraged positions (particularly from speculators in China) accelerated the downward move.
Profit Taking: After gold surged 75% in 2025, many institutional investors used the Fed announcement as a signal to "lock in" historic gains, creating massive selling pressure.
Technical Vision: Support and Resistance Levels
Market analysts are closely watching key technical indicators to see if this is a "dip" or a "trend reversal."
Level Type | Price (USD/oz) | Significance |
Resistance | $5,000 | The psychological barrier gold must reclaim to restore bullish sentiment. |
Current Pivot | $4,750 | A daily close above this level suggests the worst of the correction is over. |
Major Support | $4,400 | The 50-day Simple Moving Average (SMA); a floor that has held so far. |
Deep Support | $4,000 - $4,200 | The long-term trend line if the correction deepens. |
2026 Market Vision: Is the Bull Run Over?
While the current volatility is jarring, many major institutions remain optimistic for the remainder of 2026.
J.P. Morgan recently updated its year-end 2026 forecast to $6,300/oz, citing continued central bank diversification and government debt concerns.
Deutsche Bank maintains a target of $6,000, viewing the current slump as a "cleaning out of weak hands."
Central Bank Demand: Despite the price drop, global central banks added 863 tonnes to their reserves last year—a fundamental pillar that suggests gold's "safe-haven" status is unchanged.